The formats
Let’s generate an example directed and undirected graphs:
set.seed(123)
g_directed <- igraph::sample_gnm(12, 12, directed=TRUE)
g_undirected <- igraph::as.undirected(g_directed)
## Warning: `as.undirected()` was deprecated in igraph 2.1.0.
## ℹ Please use `as_undirected()` instead.
## This warning is displayed once every 8 hours.
## Call `lifecycle::last_lifecycle_warnings()` to see where this warning was
## generated.
igraph::igraph_options(vertex.color="white", vertex.label.color="black",
                       edge.color="black", edge.arrow.size=0.5)
plot(g_directed)
plot(g_undirected)
Digraph6
The ‘digraph6’ is designed for directed graphs. Encoding
g_directed will give:
as_digraph6(g_directed)
## [1] "&KG?E@?????GA_C?E??A????_?"
Graph6
The ‘graph6’ format is designed for undirected graphs. It is more
efficient for dense graphs. Encoding g_undirected
will give:
as_graph6(g_undirected)
## [1] "KQOGgoG??@W?"
Sparse6
The ‘sparse6’ format is designed for undirected graphs. It is more
efficient for sparse graphs. Encoding g_undirected
will give:
as_sparse6(g_undirected)
## [1] ":KcAKYRJKdLG_F"
Main functions
Main functions for encoding network data are:
Main functions for decoding are:
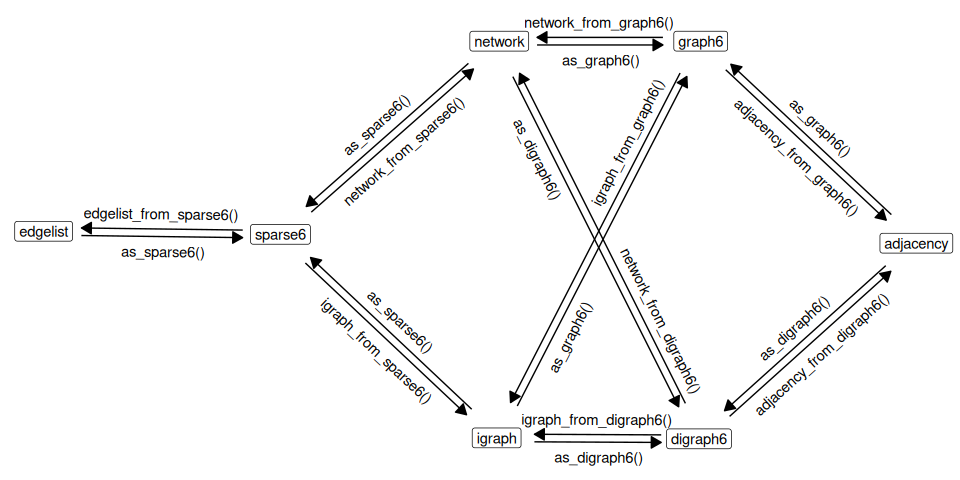
Implemented functions are shown on the following graph:

Examples
Encode a list of ‘igraph’ objects
Generate a list of igraph objects:
set.seed(666)
igraph_list <- replicate(5, igraph::sample_gnp(10, 0.1, directed=FALSE),
                         simplify = FALSE)
Encode as ‘graph6’ symbols:
as_graph6(igraph_list)
## [1] "ICG_@?W??" "I????@B?G" "I?@O????W" "I@@A?E???" "I?_?_@_??"
Encode as ‘sparse6’ symbols:
as_sparse6(igraph_list)
## [1] ":IeASjaeR" ":IoCp{^"   ":IiC]Rg"   ":IeIgWu`"  ":IgAo{@D"
Decode a vector of different types of symbols
Using example data g6, d6, and
s6 provided with the package:
# Create a vector with a mixture of 'graph6', 'digraph6' and 'sparse6' symbols
x <- c(g6[1], s6[2], d6[3])
x
## [1] "N??E??G?e?G?????GGO"
## [2] ":NkF?XduSqiDRwYU~"
## [3] "&N?R_?E?C?D??U_A????????O???????????????"

# Parse to igraph objects (package igraph required)
igraph_from_text(x)
## [[1]]
## IGRAPH 67b6c15 U--- 15 10 --
## + edges from 67b6c15:
##  [1]  1-- 7  1--11  2-- 7  2--11  2--12  2--15  5-- 9  7--10  8--15 13--15
##
## [[2]]
## IGRAPH 9e55033 U--- 15 13 --
## + edges from 9e55033:
##  [1]  2-- 7  2-- 9  4--10  6--10  6--12  7--12 11--12  5--13  6--13 10--13
## [11]  4--15 10--15 14--15
##
## [[3]]
## IGRAPH c3d3d18 D--- 15 15 --
## + edges from c3d3d18:
##  [1] 1-> 8 1->11 1->12 1->13 2->13 2->14 3->10 4-> 7 4-> 9 5-> 8 5->10 5->11
## [13] 5->13 6-> 8 9->14

# Parse to network objects (package network required)
network_from_text(x)
## Loading required namespace: network
## [[1]]
##  Network attributes:
##   vertices = 15
##   directed = FALSE
##   hyper = FALSE
##   loops = FALSE
##   multiple = FALSE
##   bipartite = FALSE
##   total edges= 10
##     missing edges= 0
##     non-missing edges= 10
##
##  Vertex attribute names:
##     vertex.names
##
## No edge attributes
##
## [[2]]
##  Network attributes:
##   vertices = 15
##   directed = FALSE
##   hyper = FALSE
##   loops = FALSE
##   multiple = FALSE
##   bipartite = FALSE
##   total edges= 13
##     missing edges= 0
##     non-missing edges= 13
##
##  Vertex attribute names:
##     vertex.names
##
## No edge attributes
##
## [[3]]
##  Network attributes:
##   vertices = 15
##   directed = TRUE
##   hyper = FALSE
##   loops = FALSE
##   multiple = FALSE
##   bipartite = FALSE
##   total edges= 15
##     missing edges= 0
##     non-missing edges= 15
##
##  Vertex attribute names:
##     vertex.names
##
## No edge attributes
Tidy graph databases
The formats shine if we need to store large number of graphs in a data frame. Let’s generate a list of random graphs as igraph objects and store them in a data frame column of graph6 symbols:
# Generate list of igraph objects
set.seed(666)

d <- data.frame(
  g6 = as_graph6(replicate(
    10,
    igraph::sample_gnp(sample(3:12, 1), p=.5, directed=FALSE),
    simplify=FALSE
  ))
)
d
##             g6
## 1        FSOT_
## 2  JYNALTg{fE?
## 3  JWwbmJNOfX_
## 4       Gr|Kto
## 5    IftZ~cXPo
## 6      H`i@]us
## 7        FClsO
## 8    IlPd`~fbg
## 9           BG
## 10      GFnwpW
Nice and compact. We can go further by doing some computations and saving the results together with the graph data:
d2 <- within(
  d, {
    igraphs <- igraph_from_text(g6)
    vc <- vapply(igraphs, igraph::vcount, numeric(1))
    ec <- vapply(igraphs, igraph::ecount, numeric(1))
    density <- vapply(igraphs, igraph::edge_density, numeric(1))
})
d2$igraphs <- NULL
str(d2, 1)
## 'data.frame':    10 obs. of  4 variables:
##  $ g6     : chr  "FSOT_" "JYNALTg{fE?" "JWwbmJNOfX_" "Gr|Kto" ...
##  $ density: num  0.333 0.473 0.509 0.607 0.6 ...
##  $ ec     : num  7 26 28 17 27 17 9 26 1 16
##  $ vc     : num  7 11 11 8 10 9 7 10 3 8
… and even save it to a simple CSV file!
write.csv(d2, row.names = FALSE)
## "g6","density","ec","vc"
## "FSOT_",0.333333333333333,7,7
## "JYNALTg{fE?",0.472727272727273,26,11
## "JWwbmJNOfX_",0.509090909090909,28,11
## "Gr|Kto",0.607142857142857,17,8
## "IftZ~cXPo",0.6,27,10
## "H`i@]us",0.472222222222222,17,9
## "FClsO",0.428571428571429,9,7
## "IlPd`~fbg",0.577777777777778,26,10
## "BG",0.333333333333333,1,3
## "GFnwpW",0.571428571428571,16,8